BrandChamp Report: Understand Program Health, Growth, and Member Performance
The BrandChamp Report gives you a clear, structured view of how your program is growing, how active your BrandChamps are, and how engagement, referrals, and rewards are distributed across your community.
It combines high-level KPIs, growth trends, engagement distribution, and a detailed member-level table so you can quickly assess program health and take action.
You’ll find the BrandChamp Report under Reports → BrandChamps.
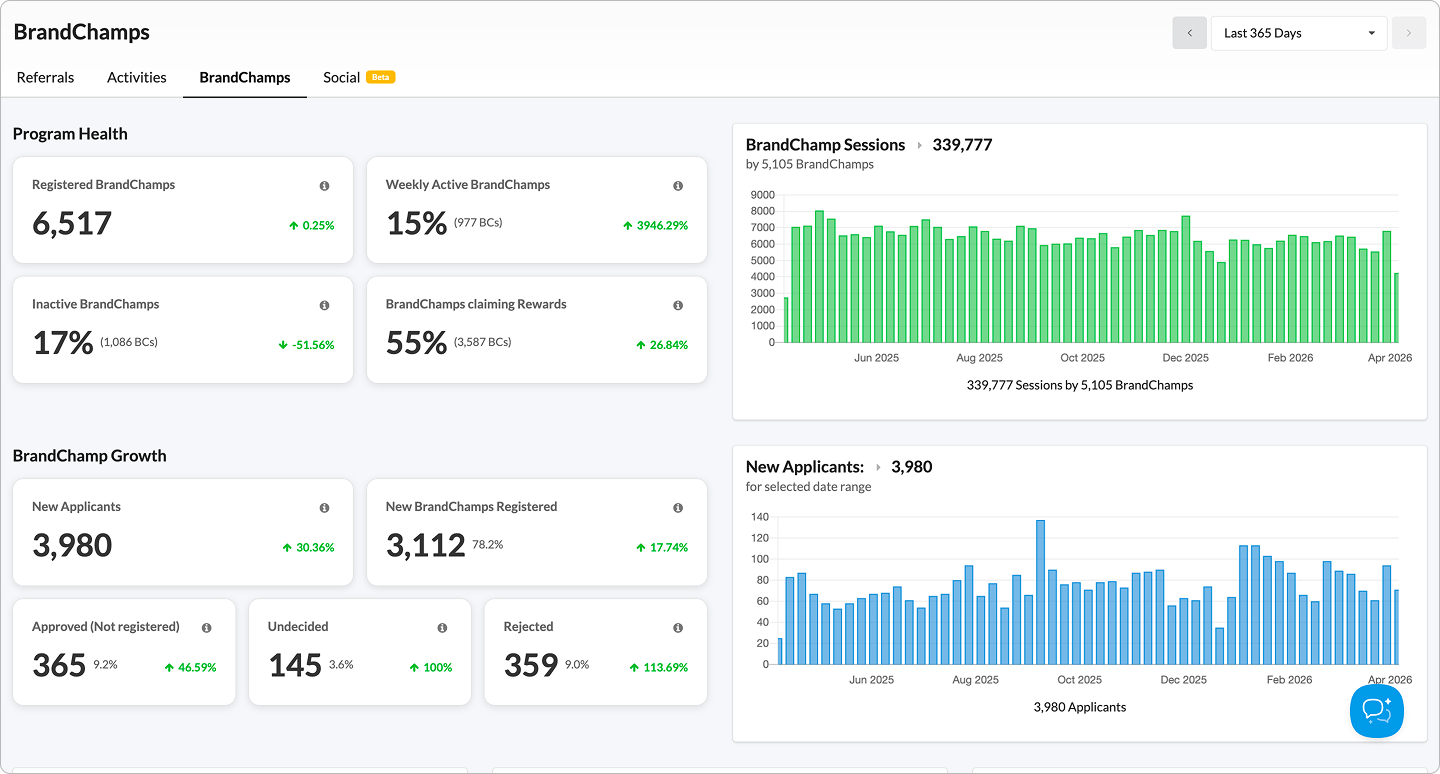
Section 1: Program Health
This section will help you understand how healthy and active is my BrandChamp community right now.
Registered BrandChamps
Total number of BrandChamps currently registered in your program.
How to use this
- Use this as your baseline community size
- Compare it over time to understand overall program growth
Weekly Active BrandChamps
Percentage and count of average number of unique BC session per week during the selected period.
How to use this
- Helps you understand active participation across the program
- A declining number may suggest engagement fatigue or fewer compelling activities
Inactive BrandChamps
Percentage and count of BrandChamps who did not engage during the selected time period.
How to use this
- Helps identify re-engagement opportunities
- A high inactive share may indicate onboarding, motivation, or content issues
BrandChamps Claiming Rewards
Percentage and count of BrandChamps who claimed rewards in the selected date range.
How to use this
- Shows whether users are actively participating in the value exchange of the program
- Lower numbers may suggest reward visibility or attractiveness needs improvement
BrandChamp Sessions
Shows total BrandChamp sessions in the selected date range, along with a trend chart over time.
How to use this
- Spot spikes or drop-offs in usage
- Validate whether launches, campaigns, or new activities are driving engagement
Section 2: BrandChamp Growth
This section helps you understand how your program is growing and where drop-offs happen in the applicant funnel.
New Applicants
Total number of new applicants in the selected date range.
How to use this
- Measure top-of-funnel growth
- Track whether your recruitment efforts are increasing application volume
New BrandChamps Registered
Number of applicants who completed registration and became BrandChamps in the selected date range.
How to use this
- Measure actual onboarding success
- Compare against New Applicants to understand conversion into active members
Approved (Not Registered)
Applicants who were approved but have not yet completed registration.
How to use this
- Identify onboarding drop-off after approval
- This can indicate friction in signup or weak follow-up communication
Undecided
Applicants who are still pending review.
How to use this
- Monitor backlog in applicant review
- A high number may suggest delayed admin action
Rejected
Applicants who were rejected in the selected period.
How to use this
- Understand selectivity in your application funnel
- Helps give a complete picture of how applicants are moving through the pipeline
New Applicants Trend Chart
Shows new applicants over time within the selected date range.
How to use this
- Spot spikes tied to campaigns, launches, or seasonality
- Identify drop-offs in recruitment momentum
- Compare periods to understand whether brand awareness or acquisition efforts are improving
Section 3: Distribution Insights
These charts help you understand whether engagement is broad or concentrated across your BrandChamp base.
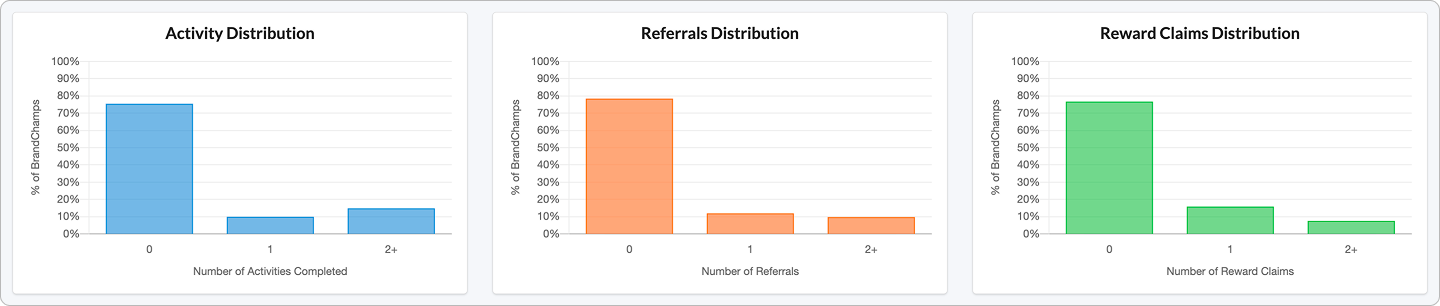
Activity Distribution
Breakdown of BrandChamps by number of activities completed.
How to use this
- Identify whether most users are lightly engaged or highly active
- Helps evaluate how widely activities are being completed across your community
Referrals Distribution
Breakdown of BrandChamps by number of referrals generated.
How to use this
- Shows whether referral performance is concentrated among a few power users or more evenly distributed
- Useful for identifying referral activation opportunities
Reward Claims Distribution
Breakdown of BrandChamps by number of rewards claimed.
How to use this
- Helps you understand how reward redemption is distributed
- Can reveal whether rewards are broadly relevant or only appealing to a small group
Section 4: BrandChamp Breakdown Table
This section gives you a detailed, row-level view of individual BrandChamp performance.
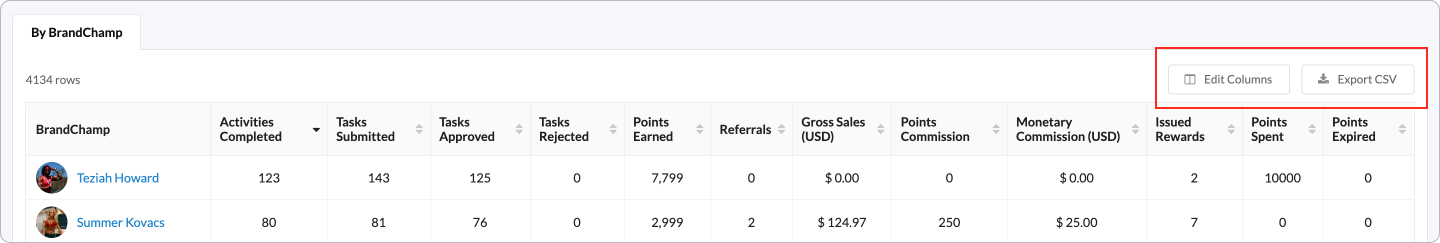
Each row represents one BrandChamp and allows you to compare engagement, referral activity, rewards, and points performance.
Default table columns may include:
- BrandChamp
- Activities Completed
- Tasks Submitted
- Tasks Approved
- Tasks Rejected
- Points Earned
- Referrals
- Gross Sales (USD)
- Points Commission
- Monetary Commission (USD)
- Issued Rewards
- Points Spent
- Points Expired
How to use this
- Identify top-performing BrandChamps
- Spot inactive or low-contributing users
- Understand who is earning, referring, or redeeming the most
Section 5: Edit Columns
The Edit Columns option lets you customize the BrandChamp breakdown table to show only the metrics most relevant to your workflow.
You can add, remove, and reorder columns based on what you want to analyze.
Available columns can include:
Activities
- Activities Completed
- Tasks Submitted
- Tasks Approved
- Tasks Rejected
- Tasks Undecided
- Points Earned
- Reward Tokens
Referrals
- Referrals
- Unique Customers
- New Customers
- Returning Customers
- Gross Sales (USD)
- Net Sales (USD)
- Points Commission
- Monetary Commission (USD)
Rewards & Points
- Selected Rewards
- Issued Rewards
- Rejected Rewards
- Cancelled Rewards
- Points Spent
- Points Expired
How to use this
- Create a simplified view for day-to-day monitoring
- Add more detailed columns when doing deeper analysis
- Compare performance across engagement, revenue, and reward behavior in one table
Section 6: Export CSV
You can export the BrandChamp breakdown table as a CSV file.
How to use this
- Share data with your team
- Perform deeper analysis outside BrandChamp
- Build custom reports in spreadsheets or BI tools
- Save filtered or customized table views for offline review
Important note
- The export reflects the columns and data currently shown in the table
- If you’ve customized the view using Edit Columns, your export should follow that selected structure
💡 Viewing a filtered segment
Reports can be filtered based on selected BrandChamps.
If you accessed this report from the BrandChamps page using filters or selected users, the data shown here reflects only that group, not your entire program.
👉 Learn how filtering works: Filter Reports by BrandChamp Segments
Recommended Workflow
- Start with Program Health to check engagement and activity levels
- Then review BrandChamp Growth to understand how applicants are moving through the funnel
- Use the New Applicants trend chart to spot growth patterns over time
- Look at Distribution Insights to understand whether engagement is broad or concentrated
- Finally, use the BrandChamp Breakdown Table to drill into individual member performance
- If needed, use Edit Columns to tailor the table and Export CSV to analyze or share the data further
How This Helps Admin Make Better Decisions
Strategic
- Is the program growing?
- Is the community active or becoming dormant?
- Are referrals and rewards broadly distributed?
Operational
- Are applicants getting stuck before registration?
- Are users returning to the platform regularly?
- Is engagement healthy across the community?
Tactical
- Which BrandChamps should be recognized or rewarded?
- Which users may need re-engagement?
- Which data points matter most for my workflow?
Important Notes
- All report data is based on the selected date range
- Some metrics reflect activity within the selected period, while others reflect current registered program state
- Distribution charts are intended to show engagement spread, not just totals
- The BrandChamp breakdown table can be customized using Edit Columns
FAQs
Why do I have many registered BrandChamps but low weekly active BrandChamps?
This usually means a large portion of your community is inactive or not engaging during the selected period.
How do I filter reports?
Go to BrandChamps, apply filters or select users, and click Reports. The selected segment will apply across all report tabs. Read more about applying filter on reports
Can I customize the BrandChamp table?
Yes. Use Edit Columns to choose which fields you want to display and in what order.
Can I export the data?
Yes. Use Export CSV to download the BrandChamp table for deeper analysis or sharing.
What’s the best way to use this report?
Start with the high-level KPIs and growth metrics, then use the distributions and table breakdown to understand where engagement is strong, where users are dropping off, and who your top contributors are.